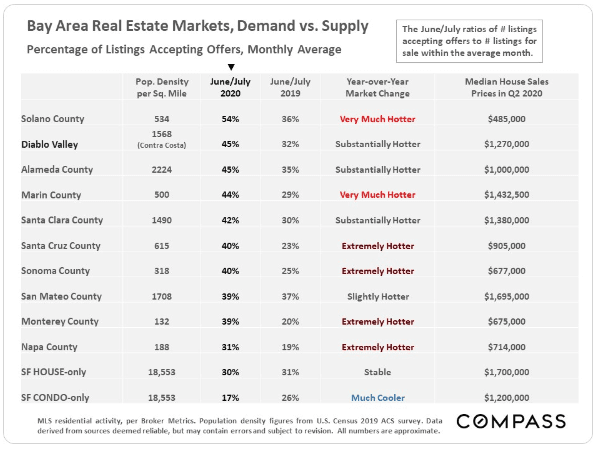
Each county is ranked by the percentage of active listings going into contract, in these examples, in June/July 2020. This standard statisic of "Market Heat" compares the booming market of today to the same period of last year and then rates the scale of the year-over-year change.
Diablo Valley is now very high in the "Market Heat" rankings as measured by this gauge, with a market substantially stronger than at this time last year.
Although it's easy to draw conclusions that the spike of inventory/speed of transactions is a "catch up" from the dramatic slow down in spring, the title of Substantially Hotter is not something to ignore, especially if you're considering a move.
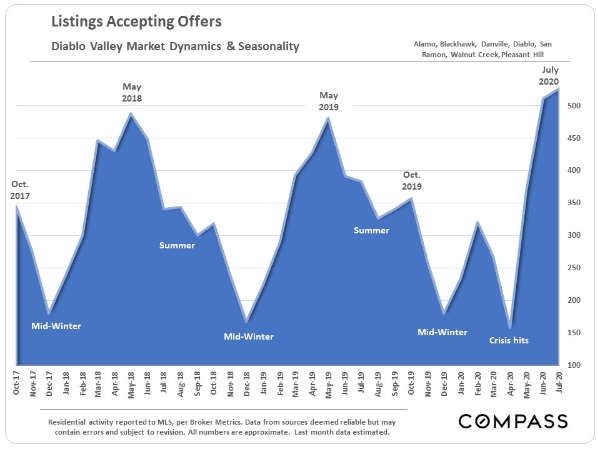
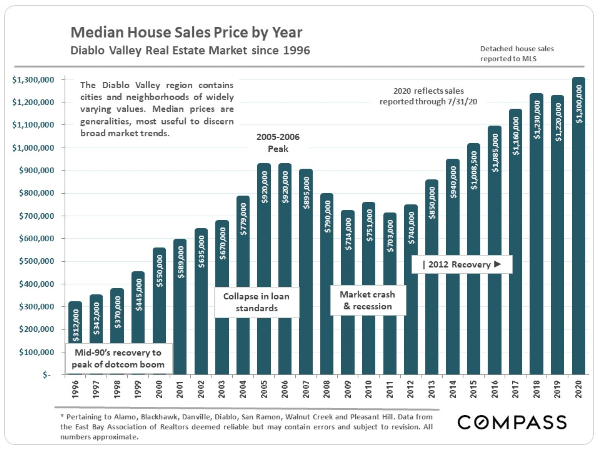
Here, you see the significant difference between the traditional peak in spring sales (March-May) between 2019 +2020 due to the COVID 19 shake up (left chart). But, you also see an incredible spike, beginning in May/June, currently exceeding projections and traditional sales trajectories.
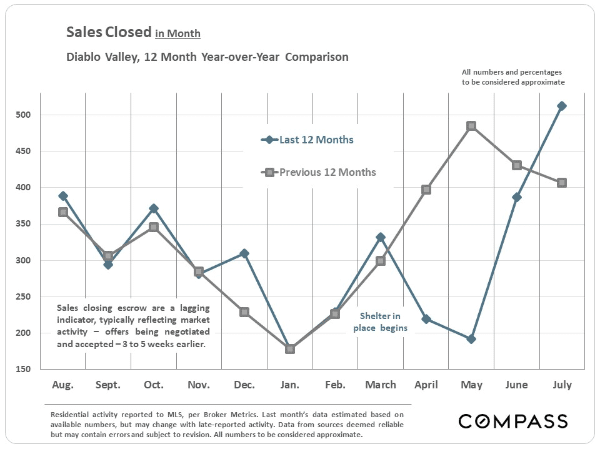
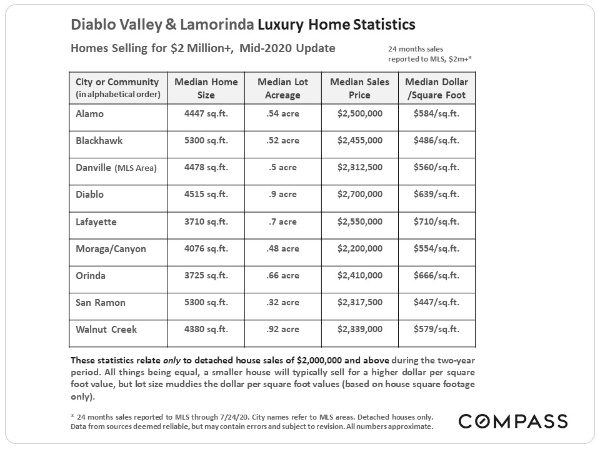
And, with the median dollar per square foot staying consistent, the increase in sales does not indicate pricing weaknesses or panic selling. Even compared to previous valleys attributed to the 2008 recession, the Median House Sales Price per year has outpaced previous market trends.
So what does this mean to you?
- Try to avoid the “wait and see” mentality. Nobody buys at the bottom — and knows it. Focus on quality as your priority: the best deal on the best match that meets your needs for years to come.
- Active buyers are more serious than ever before. People have spent the last 5 months realizing the inadequacies of their home. The buyers who are looking right now, in the middle of Covid 19, are very motivated to get a transaction done.
- Price so that the market chases you up, not down. If you don’t price correctly, chances are you'll miss out on compatible buyers.
- We don’t know what the future holds. Don’t take this buyer demand for granted. This unprecedented year is far from over — the election and ongoing pandemic could freeze real estate activity again, making it harder to sell afterwards. And if your home may require some home improvement services to shine, it’s time to take advantage of this moment when we know that contractors are still allowed inside home.
5. WORK WITH AN EXPERT!